5 good reasons to include infographics in your annual report
Bar charts, pie charts, they all have their place. But if you want to show your expertise, you can’t beat a bespoke infographic – and here’s why
1. They look interesting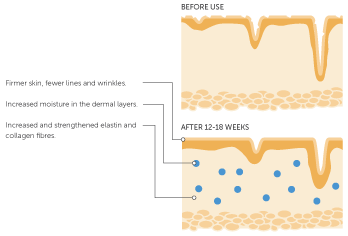
If your annual report is full of written descriptions and densely plotted charts, there’s a danger it’ll look more like a GCSE maths exam than a reason for stakeholders to get excited. Instead, bring your key points to life with appealing imagery and presentation. It’s proven that looking at a diagram helps make the mind make sense of data better than words and numbers.
2. They make data easier to understand
Too much data can be overwhelming. But broken down into segments and presented clearly and logically, it will help your readers understand more about how your business or organisation is performing and why they should be delighted to be a part of it.
3. They make you look like the expert Bespoke infographics are more time consuming than a standard graph or chart – and for that reason they make you look more professional. Adding infographics says to others: “we’re serious about what we do which is why we’ve taken the time to present our data in a creative and interesting way.”
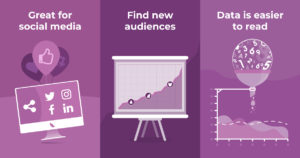
4. They’re great for social media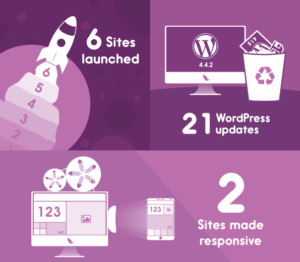
Once you’ve created infographics for your annual report, don’t just leave them there! Unique content like this is the perfect addition to your social media schedules, helping to increase brand awareness and interest. Visual posts like this are also far more likely to spark engagement than written social media posts. We live in a ‘soundbite world’ and an infographic is a visual soundbite.
5. They can help you find new audiences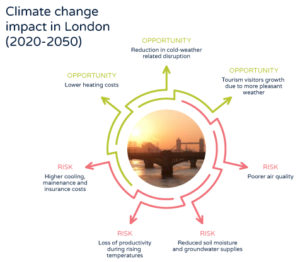
If you embed tracking code into the website where you use your infographics, you’ll be able to access a lot of information through Google Analytics about how they have been shared and the interests and occupations of the audience. You can use this to find potential new stakeholders, customers or clients.
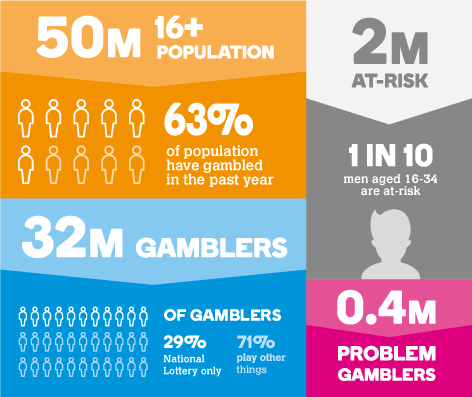
We’ve illustrated this article with a few examples of infographics we’ve created for our clients. We’d be delighted to help you with any request you may have – feel free to get in touch and discuss!
Like what you see? Get in touch