Two questions that will help every business make the most of Analytics

Google Analytics can give you huge amounts of data in great detail – too much, sometimes – and to make sense of it, you need to know what the indicators of success are. Be honest – when it comes to the website, do you really know what’s important to the business?
To answer this properly, the questions are:
1) What are the most important aims of the website?
a) If it is selling online, set up Analytics to track eCommerce sales
b) If it is receiving enquiries via a contact form, set up an Analytics Goal to track form submissions
c) If it is receiving phone calls from contact details on the website, set up a Analytics Goal to track when someone presses the link to the business phone number.
2) What are the most important metrics for the business in Analytics? Good headline stats to look out for are:
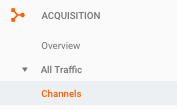
a) Visitor source (e.g. paid search, referral, non-paid search etc)
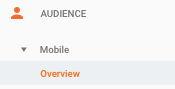
b) Visitor device type
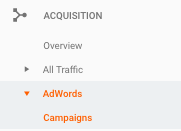
c) AdWords Campaign or Ad Group
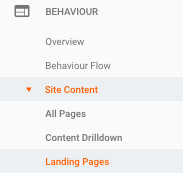
d) Landing page
By answering the questions above you will have focused your attention on the website actions that are important to the business, and also the metrics that lead to those actions.
For example, imagine a business that sells clothes. It would answer the questions above as follows:
1) Selling online is the most important aspect of the site.
2) The two most important sources of revenue are visits that come via Organic (non-paid) search and Cost-per-Click (paid) search.
Whatever the business type, setting up a weekly routine to watch the most important metrics will give an early indication of when demand is likely to pick up, or if there are potential problems to address. The data won’t tell you the reasons for the change – but regular updates means that problems can be identified and investigated before they start to have an effect on the bottom line.
Weekly Routine – Google Analytics:
– look at the last 7 days of data, compared to the previous 7 days (see our post about how to create a Dashboard in Analytics here)
– check Acquisition > Channels, see if you’ve had 3 or more consecutive week-on-week gains/falls
– check Behaviour > Content > Landing Pages, see if the top 5 pages have a week-on-week gain/ fall of more than 20%.