Why the annual report is the most exciting part of the year

Annual reports are a brilliant opportunity for business – we explain why
So you’re in charge of creating an annual report for your company or organisation. What’s your reaction?
1. “Oh hell, we’ve got to tell all those stakeholders loads of stuff again! What can we do that’s quick and easy?
2. “Brilliant. Here’s our chance to let everyone know about the fantastic work we’ve done.”
If you answered 1, we sympathise. It’s tempting to think that last year’s annual report, duly updated, will do the job. But to do that is to forget the fundamental reason you’re creating the report in the first place.
Your shareholders, investors, stakeholders and other interested parties want your business to do well – that’s why they’ve got involved. And you want to give them a reason to continue involvement, or maybe even increase it.
You’ve probably already used social media and email to send updates during the year. But that kind of communication is easy to miss and doesn’t provide much detail or background to your projects.
The annual report, on the other hand, is the perfect platform to present your successes and this is why we believe the answer to our question should be number 2.
Even if the year hasn’t been so great, your stakeholders probably know about this already. Your annual report allows you to give some context to your performance – and what you’re going to do about it. After all, no business is outstanding every year. But the best learn from their mistakes and put new ideas in place in order to overcome difficulties.
We’ve hope we’ve convinced you to think about an annual report as an exciting (or at least opportune) moment. The question now is how should the information be presented?
Your readers are likely to be very busy people. While certain elements of the report are by necessity fairly formulaic (the balance sheet and cash flow statement, for instance), you can do whatever you like in the other parts.
Presentation is everything. Consider these two examples from a parcel delivery service:
EXAMPLE 1:
Third quarter trading was down 9.2 percentage points, adversely affected by a challenging online retail environment caused by a drop in UK consumer confidence across the period compared with the previous quarter. However, we are pleased to report that by the end of the fourth quarter, an uptick in consumer confidence and increased online sales led to an increase of 2 percentage points across our services, although figures failed to reach the trading highs seen in March and April…
EXAMPLE 2:
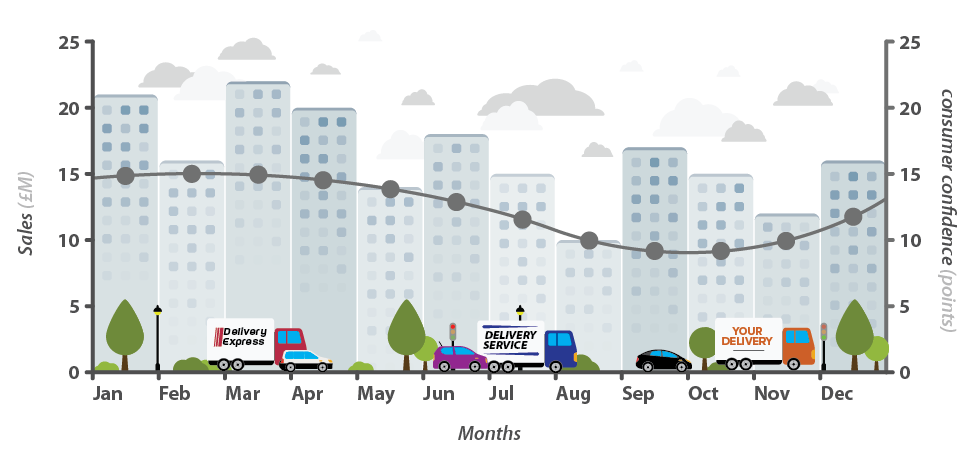
Both examples give the same information, but where the written version is almost a chore to read through, the illustration is interesting and gives the reader what they want to know at a glance.
There are lots of ways to make information easier to digest. At a minimum, we suggest:
- Using bullet points
- Using a striking design
- Infographics
Here are a couple of examples we’ve created for previous clients:
If you want to make a bigger impact, consider:
- A postcard summarising key points
- Unusual formats and sizes
- A copywriter to make the report more readable and include quotes, examples and human interest stories where relevant
- Adding laser cuts, foil detail, origami or heat-reactive ink!
We can help with all these elements – why not get in touch when it’s time for your annual report?
Like what you see? Get in touch